Why It Matters Where You Randomize Users in A/B Experiments

When designing A/B experiments, you often need to consider tradeoffs between the ideal experiment design you want and the existing experimentation infrastructure you’re working with. Sometimes the tradeoff is small, but other times it can result in losing weeks of product and engineering work while waiting for experiment results to materialize!
A common experimentation design decision is which population to randomize. Should you randomize all users that could theoretically be exposed to a new feature, or only users who definitely would be exposed? At the top of the funnel, or somewhere halfway through the funnel?
A/B Testing at Colorify
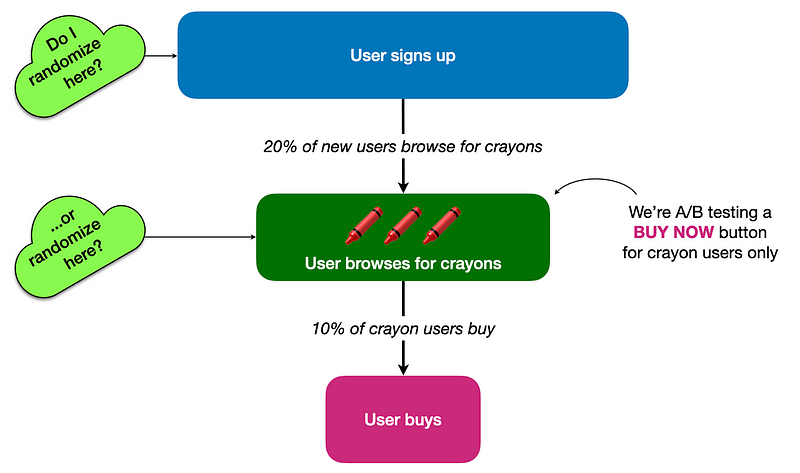
Let’s design an A/B test for a pretend company, Colorify, which sells pencils ✏️ and crayons 🖍️ for coloring book enthusiasts. Some are free, and some are sold at a premium. Users can browse for pencils or for crayons but these are separate experiences where some users view the pencil menu and others view the crayon menu.
We designed a new “buy now” button for the crayon menu, so we’re going to run an A/B test to see if the new button increases conversions among users browsing crayons. We need to decide if we’ll randomize all new users signing up, or only crayon users.
This can be illustrated either as a user flow diagram or as a funnel chart:
User flow diagram.
Funnel chart.
Randomizing all users is something most experiment platforms can handle, but extra engineering work is often needed in order to trigger randomization when a specific event occurs (in this case, when the user browses for crayons). So our A/B experiment design decision is:
- Invest engineering resources first to enable randomization of only new users browsing for crayons. But now we’ll have to wait a while before the experiment can launch.
- Go ahead and randomize all users. We can launch the experiment now, but what is the cost of all these irrelevant observations of new users who won’t ever browse for crayons?
We can make this decision by running power analyses for both approaches and comparing the output. Let’s set some baseline numbers. In the last 28 days:
- 100,000 users signed up
- 20,000 (20%) users browsed the crayon menu
- 2,000 crayon users converted
- The crayon conversion rate is 10% (2,000 / 20,000)
We think our new “buy now” button will produce a 10% conversion uplift. That’s 200 incremental crayon conversions (2,000 * 10%), generating 2,200 crayon conversions for a new crayon conversion rate of 11% (2,200 / 20,000).
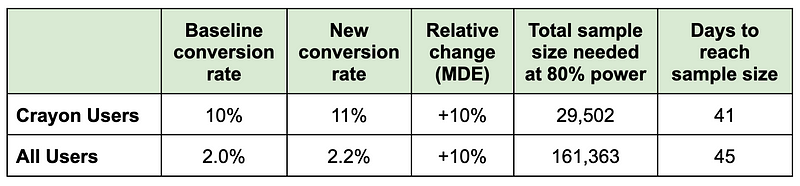
🖍️ 🖍️ Scenario 1: All Our Conversions Come From Crayons
Suppose that at Colorify, all our conversions come from crayon users. We don’t convert any pencil users, because we give them away for free. In this case, our crayon conversion uplift is also the overall conversion uplift! Surprised? Let’s work out the overall numbers.
- Our overall conversion rate is based on all users in the denominator, not just crayon users. That’s 2.0% (2,000 / 100,000)
- A 10% conversion uplift among crayon users equals 200 incremental conversions
- This means we now have 2,200 overall conversions (2,000 + 200)
- Our new overall conversion rate would be 2.2% (2,200 / 100,000)
- The relative difference between 2.0% and 2.2% is…10%!
So our expected uplift is the same regardless of whether we are measuring only crayon users or all users, because crayon users are our only source of our conversions. But our baseline conversion rate is different based on which population we’re randomizing, which means our power calculations are going to be different too.
I like using Evan Miller’s sample size calculator for quick power analyses but for this article I’m using the power.prop.test() function in R which produces slightly different numbers.
We calculate the days to reach target sample size by dividing the total sample size by the number of new users we get every 28 days:
- 29,502 / 20,000 crayon users per 28 days * 28 days = 41.3 days
- 161,363 / 100,000 overall users per 28 days * 28 days = 45.2 days
Even though the expected uplift (we can use this as the MDE, minimum detectable effect) is the same in both groups, the different baseline conversion rates means we’ll get different sample sizes. If we randomized all users, it’ll take four days longer to run the experiment compared to if we had randomized only crayon users.
Four days may not be such a big tradeoff, especially if we don’t have the experimentation infrastructure yet to target only a subset of users.
But once we start playing with the numbers, we’ll quickly learn that the tradeoff between launching now or waiting for engineering work to enable more precise randomization gets much bigger!
🖍 ✏ ️️Scenario 2: Half Of Our Conversions Come From Crayons And Half From Pencils
Let’s say Colorify actually isn’t giving away pencils for free. In fact, half of our conversions come from crayons and the other half from pencils.
Now, any crayon conversion rate changes will produce half of as big a change in the overall conversion rate. Let’s work through it:
- We still have a baseline 10% crayon conversion rate = 2,000 crayon conversions. With a 10% uplift, we get 200 incremental conversions, and our new crayon conversion rate will be 11%.
- But we also have 2,000 pencil conversions for a total of 4,000 overall conversions. This means we have a new baseline for the overall conversion rate: 4.0% (4,000 / 100,000).
- With a 10% uplift among crayon users, we get 4,200 overall conversions (4,000 + 200). That is a new conversion rate of 4.2% (4,200 / 100,000).
- The uplift from 4.0% to 4.2% is 5%…not 10%!
Now both the baseline conversion rate and the MDE are different depending on which population we’re randomizing:
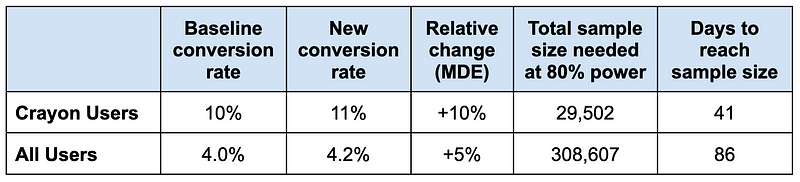
Suddenly it’s going to take twice as long to run an experiment if we randomized all users. If we put in the engineering effort to improve our user randomization capabilities, we could shave six weeks off our experiment length!
✏️ ✏️ Scenario 3: Most Of Our Conversions Come From Pencils
Imagine most of our conversions came from pencils. This makes our Colorify executives nervous, and they tell us to diversify our conversion sources by increasing crayon conversions. By now, you know we’ll be better off randomizing only crayon users, because otherwise the crayon conversion uplift (the signal) will be far too small to measure when combined with all other conversions (the noise).
- We’ve still got the baseline 10% crayon conversion rate = 2,000 crayon conversions.
- But we also have 10,000 pencil conversions, for a total of 12,000 overall conversions. This means we have an overall conversion rate of 12.0% (12,000 / 100,000).
- Again, we achieve a 10% crayon conversion uplift meaning 200 incremental crayon conversions for a new crayon conversion rate of 11%.
- We now have 12,200 overall conversions for a new overall conversion rate of 12.2%. The overall conversion uplift is 1.7% (12.0% to 12.2%)
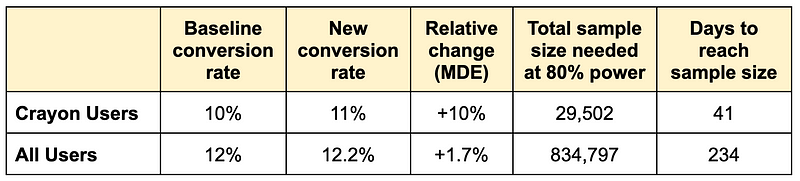
A month and half vs. 8 months. No-brainer here, right? 🤓
Conclusion
Randomizing over a bigger population will always get you more users in an experiment. But that doesn’t always translate to shorter experiment lengths, because you’re changing the signal vs. noise ratio. By randomizing all users, you’re collecting irrelevant observations, reducing signal and increasing noise, and diluting the effect size. When you randomize based on a specific user behavior, such as browsing for crayons, you can dramatically improve the sensitivity of your A/B experiments and get your learnings faster.
In order to make the best possible decisions about A/B experiment design and about building out your experimentation infrastructure (which often happens in parallel), you need to have baseline measures of your existing user behavior. That, in turn, requires instrumenting event tracking such as Segment, Snowplow, or Apache Kafka. Instrument the critical touch points in your funnel and start collecting basic user behavioral data. Once you’ve collected this data, you can then start running power analyses and use their output to decide whether you can launch an experiment now or put in more engineering work first.
And once you’ve got this data, you’re on your way to designing better product experiments, meaning you can learn new things about your product, features, and users faster!
💙 Thanks to Chetan Sharma, Paul Stubley, Will Kemp, & Leonid Pekelis for terrific and insightful comments on earlier drafts of this article.