Goal-Based Forecasting in Prophet & R
Guide business teams by generating forecasts that reach specific goals or targets.
Forecasting tools are everywhere. But it’s surprisingly hard to figure out how to adjust modeled forecasts to meet a goal or target, which business teams often ask for!
With some historical data, you can use forecasting tools to predict into the future a specific metric (e.g., number of active users, revenue, products sold, babies born). Good forecasting tools will factor in seasonality (fluctuations based on days of the week or months of the year), overall growth, holidays, and other variables to model more plausible, reliable predictions.
However, businesses set “goals” and “targets.” How do we construct forecasts that meet those goals and targets? Let’s pretend we’re data scientists at Tuckersoft, and we’ve just built a forecast that predicts 15,000 copies of Nohzdyve will be sold in July 1985. Because we’re great data scientists, we’ve also provided projected sales for every day in July (e.g., “On July 3rd, we project to sell 472 copies”), and those daily sales take into account seasonality, growth, and holidays.

Nohzdyve. Took me a while to realize it’s pronounced “nosedive.” 🤦🏻♂️
But Mr. Thakur has given his sales team a July 1985 target of 18,000 copies. Now how do we “update” the forecast to match the goal? The easy way: take the difference between the projected number and the target number, and evenly distribute it across the date range we’re interested in. So we take 3,000, divide it by 31 days, and tell Mr. Thakur that we need to sell about 97 extra copies every day to meet the target.
However we’re now ignoring seasonality and all the other cool things that go into our forecasting model! Maybe we tend to have higher sales on weekends, and we don’t expect to sell anything on Independence Day (July 4th). Adding 97 to each day’s predicted sales doesn’t consider those factors. We want to change our forecast so that it now predicts 18,000 copies sold, while still factoring in seasonality and other variability. Then the sales team can measure the daily progress against the adjusted goal-based forecast.
Using Prophet
Prophet is this great time-series forecasting tool produced by Facebook and available in R and Python. I consider it the Ron Popeil of forecasting tools — you just set it and forget it!

Set it and forget it! 🎉
With Prophet, a forecast can be created with just a few lines of R code:
And that’s it! Prophet generates forecasts by decomposing for trend, seasonality, and holidays — easy ideas for analysts to grasp. Models can be tweaked by setting parameters in the prophet() call, and holidays can be factored in using aholidays dataframe listing dates. Nifty charts showing trends and seasonality by year, week, and day are easy to generate with Prophet function calls. Trend changepoints are automatically calculated but they can also be manually inserted or further specified in cases of overfitting/underfitting. See here for more discussion of Prophet’s features.
Modeling Goal-Based Forecasts in Prophet
But how to get a forecast that matches a preset goal or target? That’s what predictive_samples() is for. That function generates (by default) 1,000 samples from the “posterior predictive distribution.” Each sample is a slightly different forecast based on the historical data and the Prophet model. You just find which sample is closest to your target, and that sample represents a possible, plausible path towards the target, with seasonality and holidays factored in.
In this way, our forecast isn’t really adjusted, but rather we take advantage of computational boostrapping/sampling functions to produce hundreds or thousands of forecasts until we find a new forecast that best represents reaching the goal.
Example: LA Metro Bike Share Rides
Let’s do an example here. I’ve created a CSV of daily ride data downloaded from Los Angeles’s Metro Bike Share, from July 7, 2016 (launch) to September 29, 2018 (the most recent data available).
We get this chart:
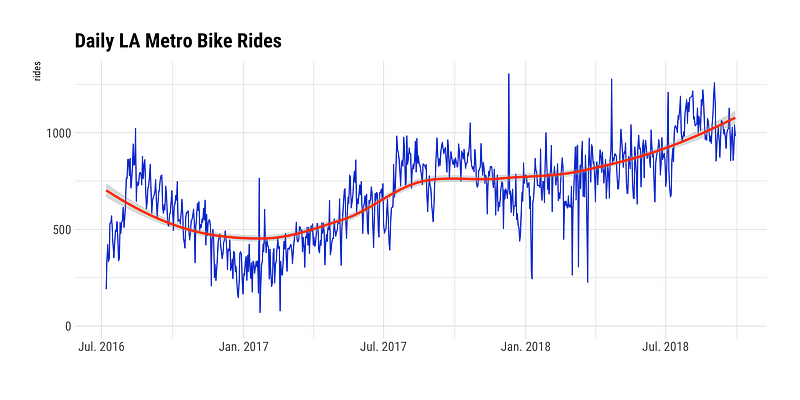
Historical data for Los Angeles Metro Bike Share 🚲
We can see some yearly seasonality, where rides are higher during the summer months. There’s also a trend changepoint where rides seemed to really take off. What about weekly seasonality? One way to check is to look at weekdays vs. weekends:
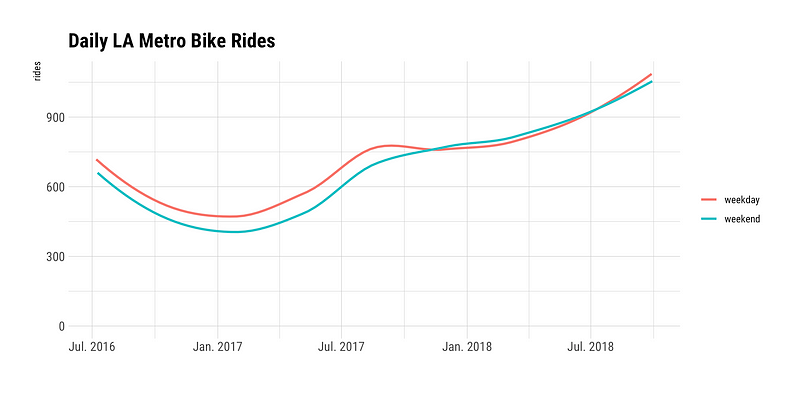
🚴♀ Weekdays vs. Weekends 🚴
In 2017, weekends saw lower ridership than weekdays, but that trend changed by 2018 to be more or less equal. This is the sort of thing that Prophet handles well by decomposing for overall trend and by daily, weekly, and yearly seasonality, out-of-the-box.
I called prophet() on the historical data to generate the Prophet model, then called predict() which uses that Prophet model to forecast daily rides out to September 1, 2019. For this example, I made the trend less flexible by decreasing the changepoint parameter from the default of 0.05 to 0.01:
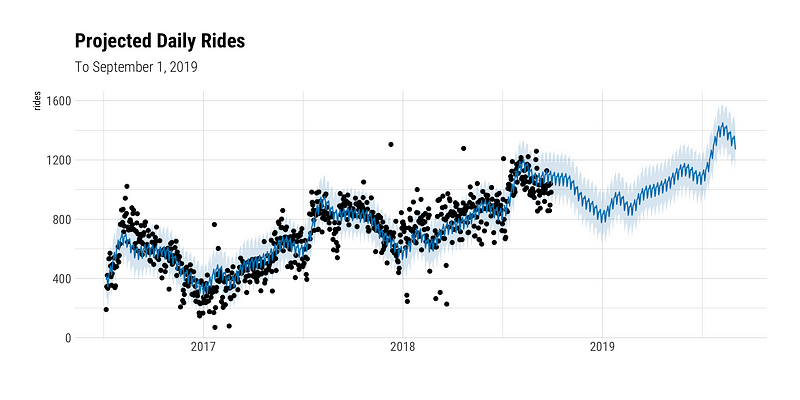
According to this model, we’ll have 1,272 rides on September 1, 2019
This Prophet model generated forecasts for each day between September 29, 2018 and September 1, 2019, and predicted 1,272 rides on September 1, 2019. To see how Prophet decomposes trend and seasonality, prophet_plot_components() generates the following chart:
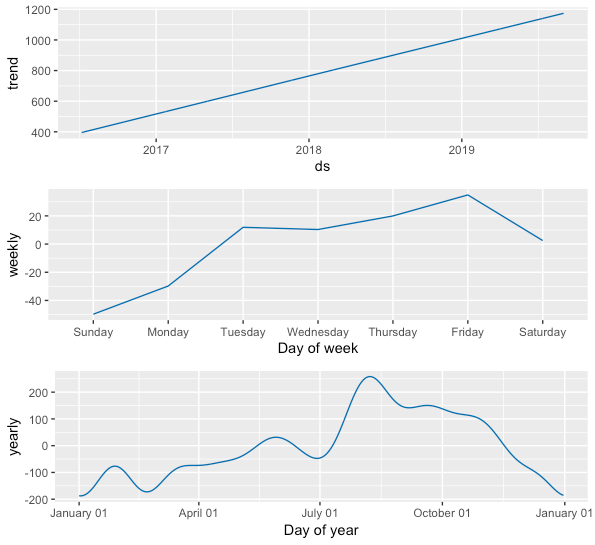
📈 📉 Components of a Prophet model.
A very linear trend across years, lower ridership on weekends, and higher ridership during late summer — all that goes into the model and are weighted towards calculating the daily ridership projections.
Goal: 1,500 rides
But the sales team wants to reach 1,500 rides by September 1, 2019. With that target in mind, what should our daily ridership look like?
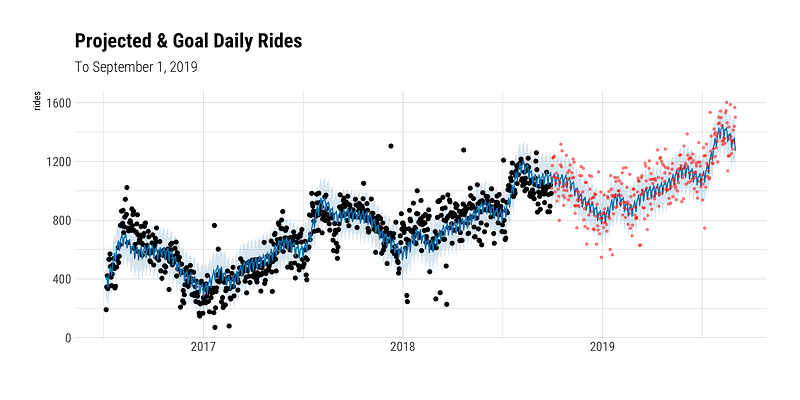
Running predictive_samples() using the same Prophet model returned 1,000 samples (as columns) from the posterior predictive distribution, with as many rows as there are for days you predicted over. As explained above, each one of them is a possible, plausible forecast. I looked at the row corresponding to September 1, 2019 then found the cell closest to 1,500 rides across the 1,000 columns (samples). The column containing that cell is the adjusted, goal-based forecast I want to give to the sales team!
The red dots below show the adjusted daily ridership we want to achieve in order to reach 1,500 rides on September 1, 2019.
The red dots 🔴 show the adjusted daily ridership we want to achieve to meet our Sep. 1, 2019 target.
Here’s an zoomed-in version:
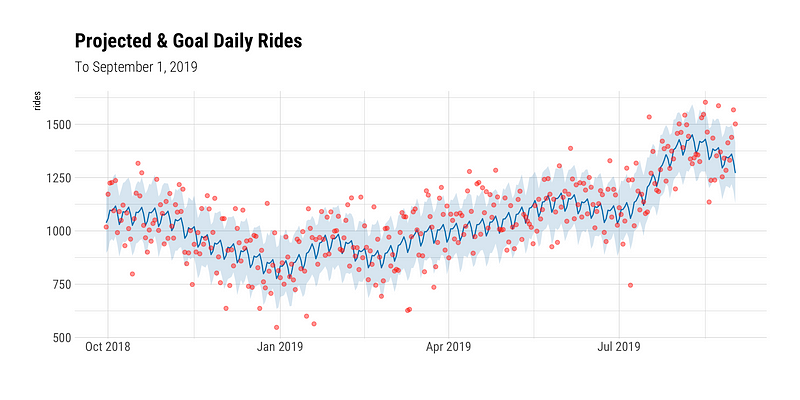
Zoomed In: The red dots 🔴 show the adjusted daily ridership we want to achieve to meet our Sep. 1, 2019 target.
You’ll see that some adjusted daily ridership projections are below the Prophet model’s original projections. This is just one sample out of 1,000 samples generated, and so the model will produce some extreme data points. However, the adjusted ridership projection predicts on average 13 daily rides more than the original projection. And each day’s adjusted projection will take seasonality and holidays into account to produce more reliable, plausible daily forecasts.
To prevent the sales team from working with data points below the original projection, the original and adjusted ridership projections can be mashed together such that on any particular date, if the original ridership projection is higher than the adjusted projection, you keep the original value, and vice versa. That produces what I’ve (just decided to) call a “high target” projection — something ambitious the sales team can aim for.
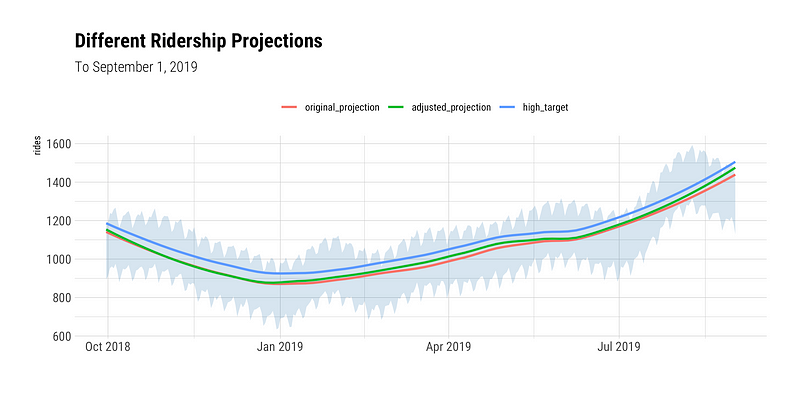
Three projections! 📈 Original, adjusted, and a “high target” projection.
“High target” projections are one way of handling adjusted forecasts with more extreme individual data points, but I’m sure there are many different approaches that can be used here! Monthly goals are easy to do, too — just subset thepredictive_samples() result by the rows corresponding to the month you’re interested in, sum the daily values across the rows for each of the 1,000 column (samples), and find the one closest to the target value.
This was a simple example using a basic Prophet model, but the use of predictive_samples() becomes more powerful as the underlying Prophet model gets better-tuned by setting additional parameters. Overall, Prophet’s an impressively simple forecasting tool that packs a punch and allows you to extract goal-based projections that meet a particular target, which is a deliverable business teams are often asking for!
Are there other ways to produce goal-based forecasts? Please share below.
Note: This post was inspired by this clumsily-written question I asked in this Github issue — thanks to Ben Letham for pointing me in the right direction! All R scripts (using tidyverse code), data, and figures are available at my Github repo.